

Reference · Industry and manufacturing
Sub-metering of machinery in mechanical engineering II
- Client
- Tsubaki Nakashima
- Project goal
- Sub-metering at the level of individual machines
- 54
- Metering points
- 84
- Devices installed
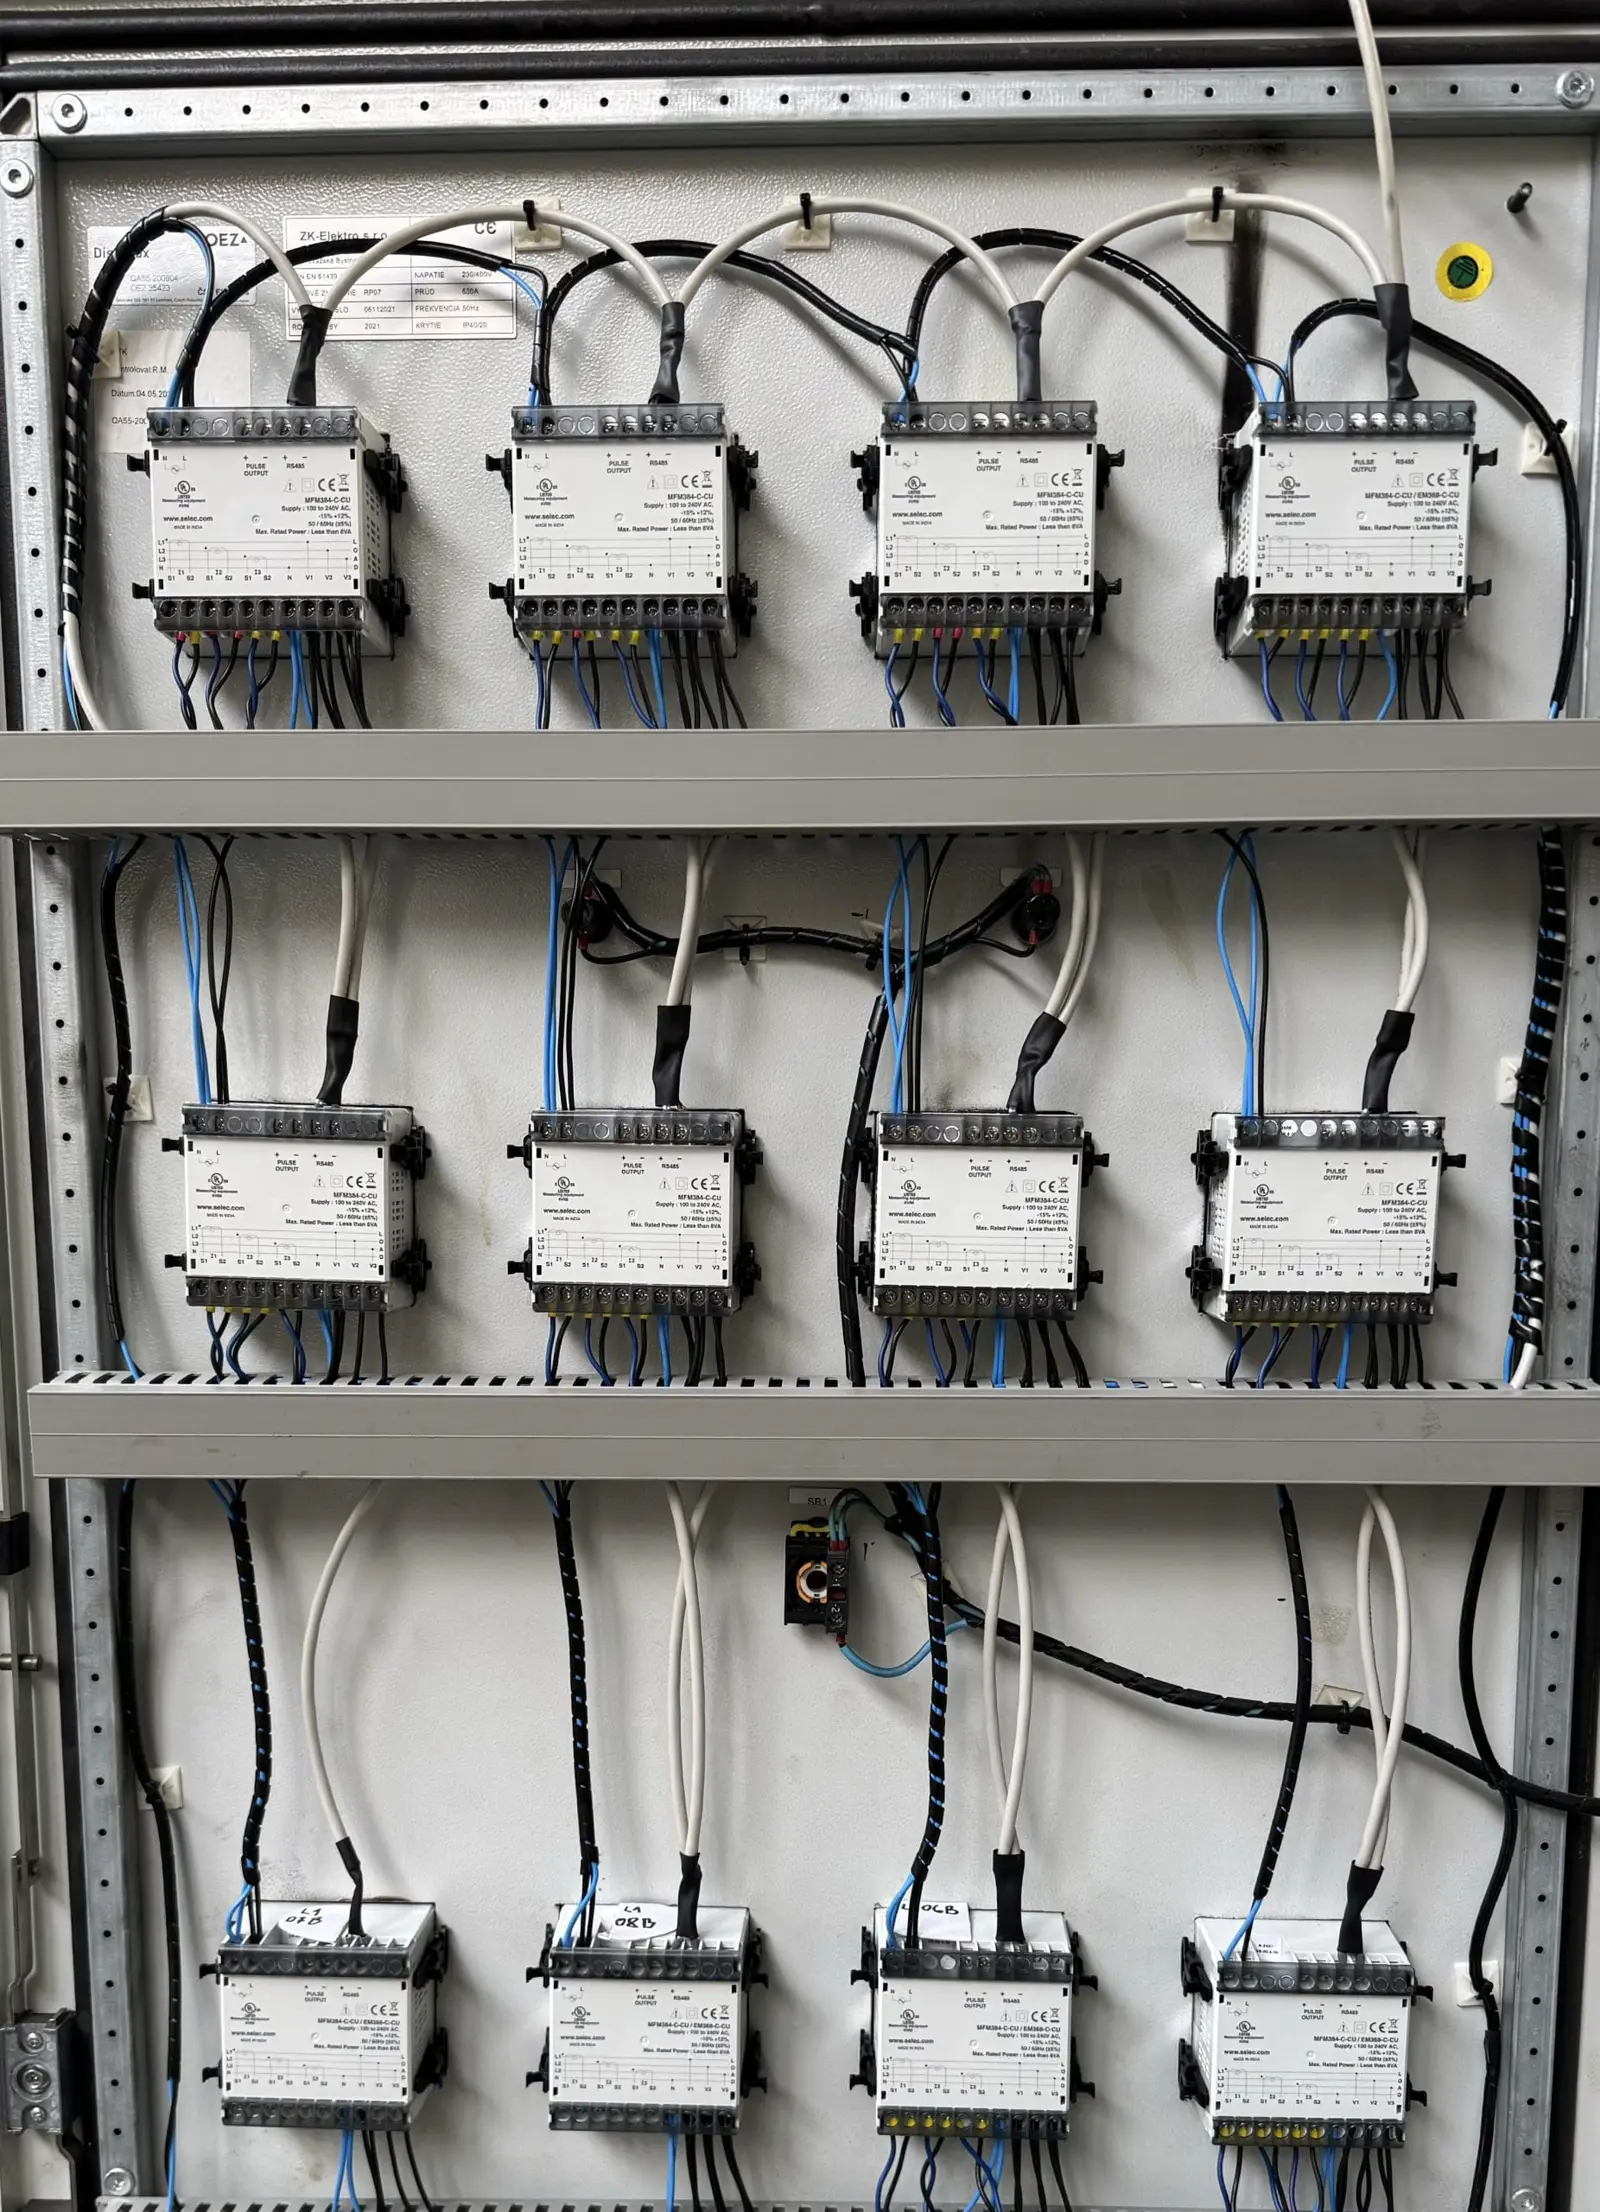
How it is connected
Solution diagram
Simplified diagram based on the project description.
01 · Metering
Meters on production machinery and electrical equipment
- Electricity
- 54 · metering points
- 84 · devices installed
02 · Transfer
Modbus RTU/TCP converters
03 · Data collection
Revolution Pi
- UPS backup power
04 · Network
Separate VLAN with internet access and remote management
05 · System
Visualisation
- Real-time consumption
- Operating state signalling
- Machine states: production, idle, standstill
Project summary
In the second phase of the project, we built on the electricity sub-metering infrastructure already in place at a mechanical engineering plant that makes high-precision products.
The extension added metering of further production machinery and electrical equipment to the existing data collection system. The new metering points were incorporated into the original communication architecture so that the scope of consumption monitoring could grow without changing the basic concept of the solution.
The added metering devices were integrated into the existing sub-metering infrastructure with an emphasis on keeping a uniform method of communication, centralised data collection and separate network operation. The solution thus extended the technical overview of electricity consumption to further parts of production and enabled a more detailed evaluation of how individual process units operate.
The second phase was a natural extension of the original system, aimed at increasing the granularity of metering, filling in the sections not yet metered and creating a more accurate data basis for tracking the plant’s energy intensity.
Implementation
In the second phase, we built on the existing industrial edge solution based on a Revolution Pi, which collects and aggregates data from the metering devices. The new metering devices were incorporated into the communication infrastructure already in place and connected to the existing data collection system.
Communication runs on a separate VLAN with internet access, which allows separate network operation and remote management of the devices. The integration kept the original communication concept: metering devices, Modbus RTU/TCP converters and a central connection to the network infrastructure.
The Revolution Pi runs on a backup UPS with a battery, which reduces the risk of data collection being interrupted by a power failure. This ensures greater continuity of metering and a stable data flow from the individual metering points.
The added metering points were then integrated into the visualisation part of the solution, which displays measured data in real time, evaluates consumption and signals selected operating states. The solution still includes recognition of each machine’s state, so it is possible to track whether the equipment is in production, idle or at standstill.
Results
In the second phase, 54 metering points and 84 electrical devices were integrated into the existing sub-metering system. The extension added metering of further parts of production and increased the level of detail of data collection from the process equipment.
The new metering points were incorporated into the original communication and data infrastructure, keeping the system’s architecture uniform. Data from the added devices is collected centrally and follows the existing method of metering, communication and visualisation.
The result of the second phase is an extended electricity sub-metering system that gives a more detailed technical overview of consumption at the level of individual machines and production units. The customer thus gained a more accurate data basis for evaluating consumption, identifying energy-significant loads and analysing operations technically.
This stage will be followed by a further phase that plans to extend the system to metering other utilities and operating quantities. The extension will add metering of water and gas and monitoring of ambient temperature and humidity, moving the system from electricity sub-metering to more comprehensive collection of operating data across the plant.
On site
Photos from the project
6 shots straight from the installation.
Machine states
Production, standstill, idle at every machine
The solution recognises the state of each machine. From the metering, the system can tell whether a machine is producing, standing under power, or switched off. This is what one shift looks like.
Morning shift · 06:00–14:00
Now 14:00
Drag along the timeline to look at any moment of the shift.
- Production: the machine is producing
- Idle: switched on, but not producing
- Standstill: switched off or on standby
Line utilisation76 %
Draw outside production15.4 kWh
illustrativeIllustrative shift profile
Illustrative shift profile: CNC centre utilisation 85 %, Lathe utilisation 73 %, Press utilisation 56 %, Robot cell utilisation 89 %; line utilisation 76 %, draw outside production 15.4 kWh.
Industry and manufacturing
More projects in the segment
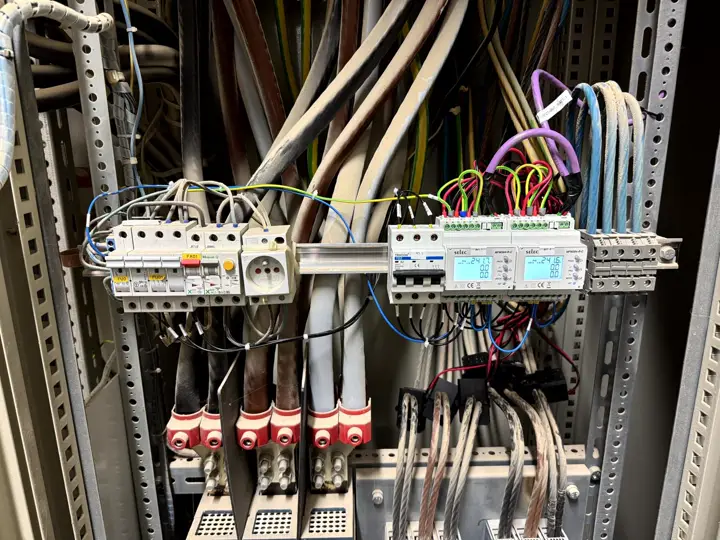 Industry and manufacturingElectricity monitoring in the furniture industryEkoltech · furniture manufacturer, Fiľakovo28 pts · 15 pcs
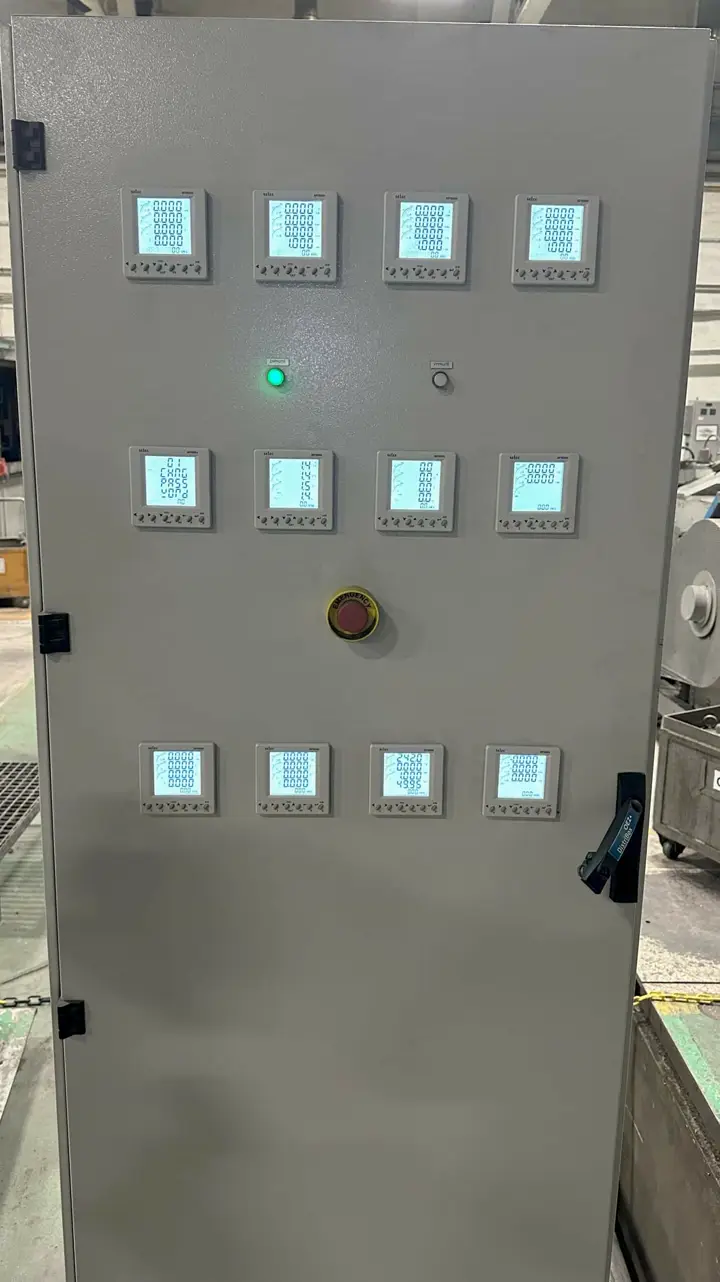 Industry and manufacturingSub-metering of machinery in mechanical engineeringTsubaki Nakashima · mechanical engineering79 pts · 109 pcs
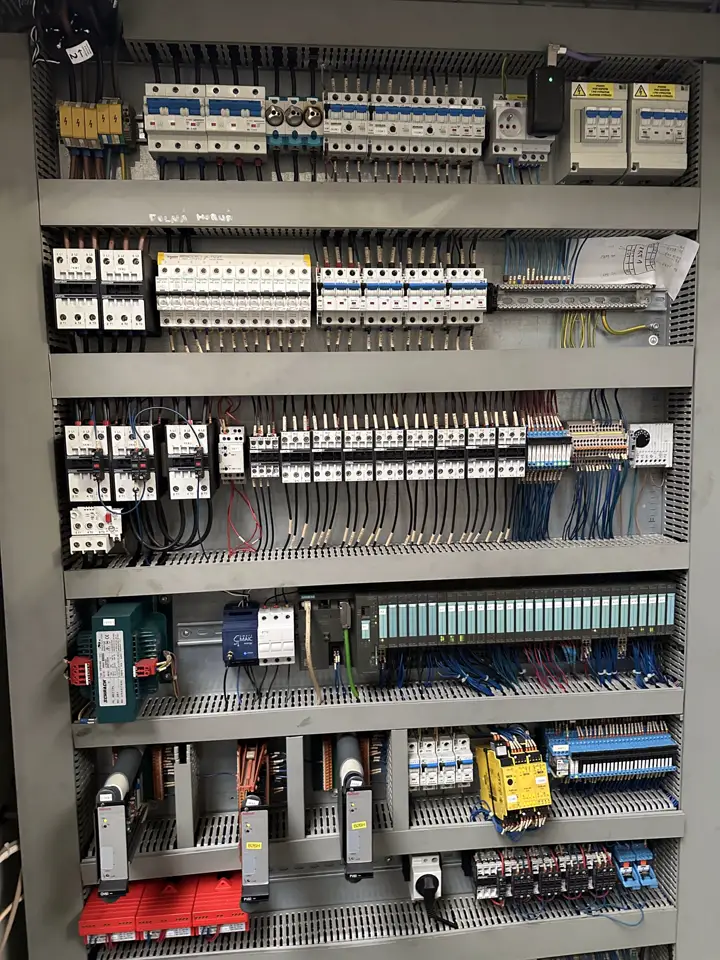 Industry and manufacturingEnergy monitoring integrationVegum · rubber industry40 pts · 45 pcs
All projects in Industry and manufacturing
Continue to another segment
Contact
Want a similar result at your site?
We start with a site visit and a no-obligation quote. A pilot project on one building proves the benefit before you decide on full deployment.
Write to us
For clients and partners
- Mgr. Denis HriňCo-founderhrin@
nidextechnology.com+421 905 134 635 - Ing. Nicolas HečkoCo-founderhecko@
nidextechnology.com+421 904 418 299
Please call before visiting