

Reference · Public sector
Energy monitoring at transformer station level
- Client
- Agrokomplex Nitra
- Project goal
- Sub-metering integration
- 16
- Metering points
- 32
- Devices installed
How it is connected
Solution diagram
Simplified diagram based on the project description.
01 · Metering
Metering devices in the transformer stations
- Electricity
- 16 · metering points
- 32 · devices installed
02 · Transfer
Modbus RTU · Wi-Fi access points
03 · Network
Separate VLAN over a VPN tunnel
04 · System
Central system
- Data visualisation
- Monitoring of maximum reserved capacity
Project summary
For our client from the state sector, which manages large exhibition grounds, we delivered an advanced integration of electricity sub-metering. The main aim was a detailed overview of consumption across several buildings and venues that are rented out for various events and exhibitions during the year. Accurate energy consumption data is essential for optimising operating costs and managing energy use effectively.
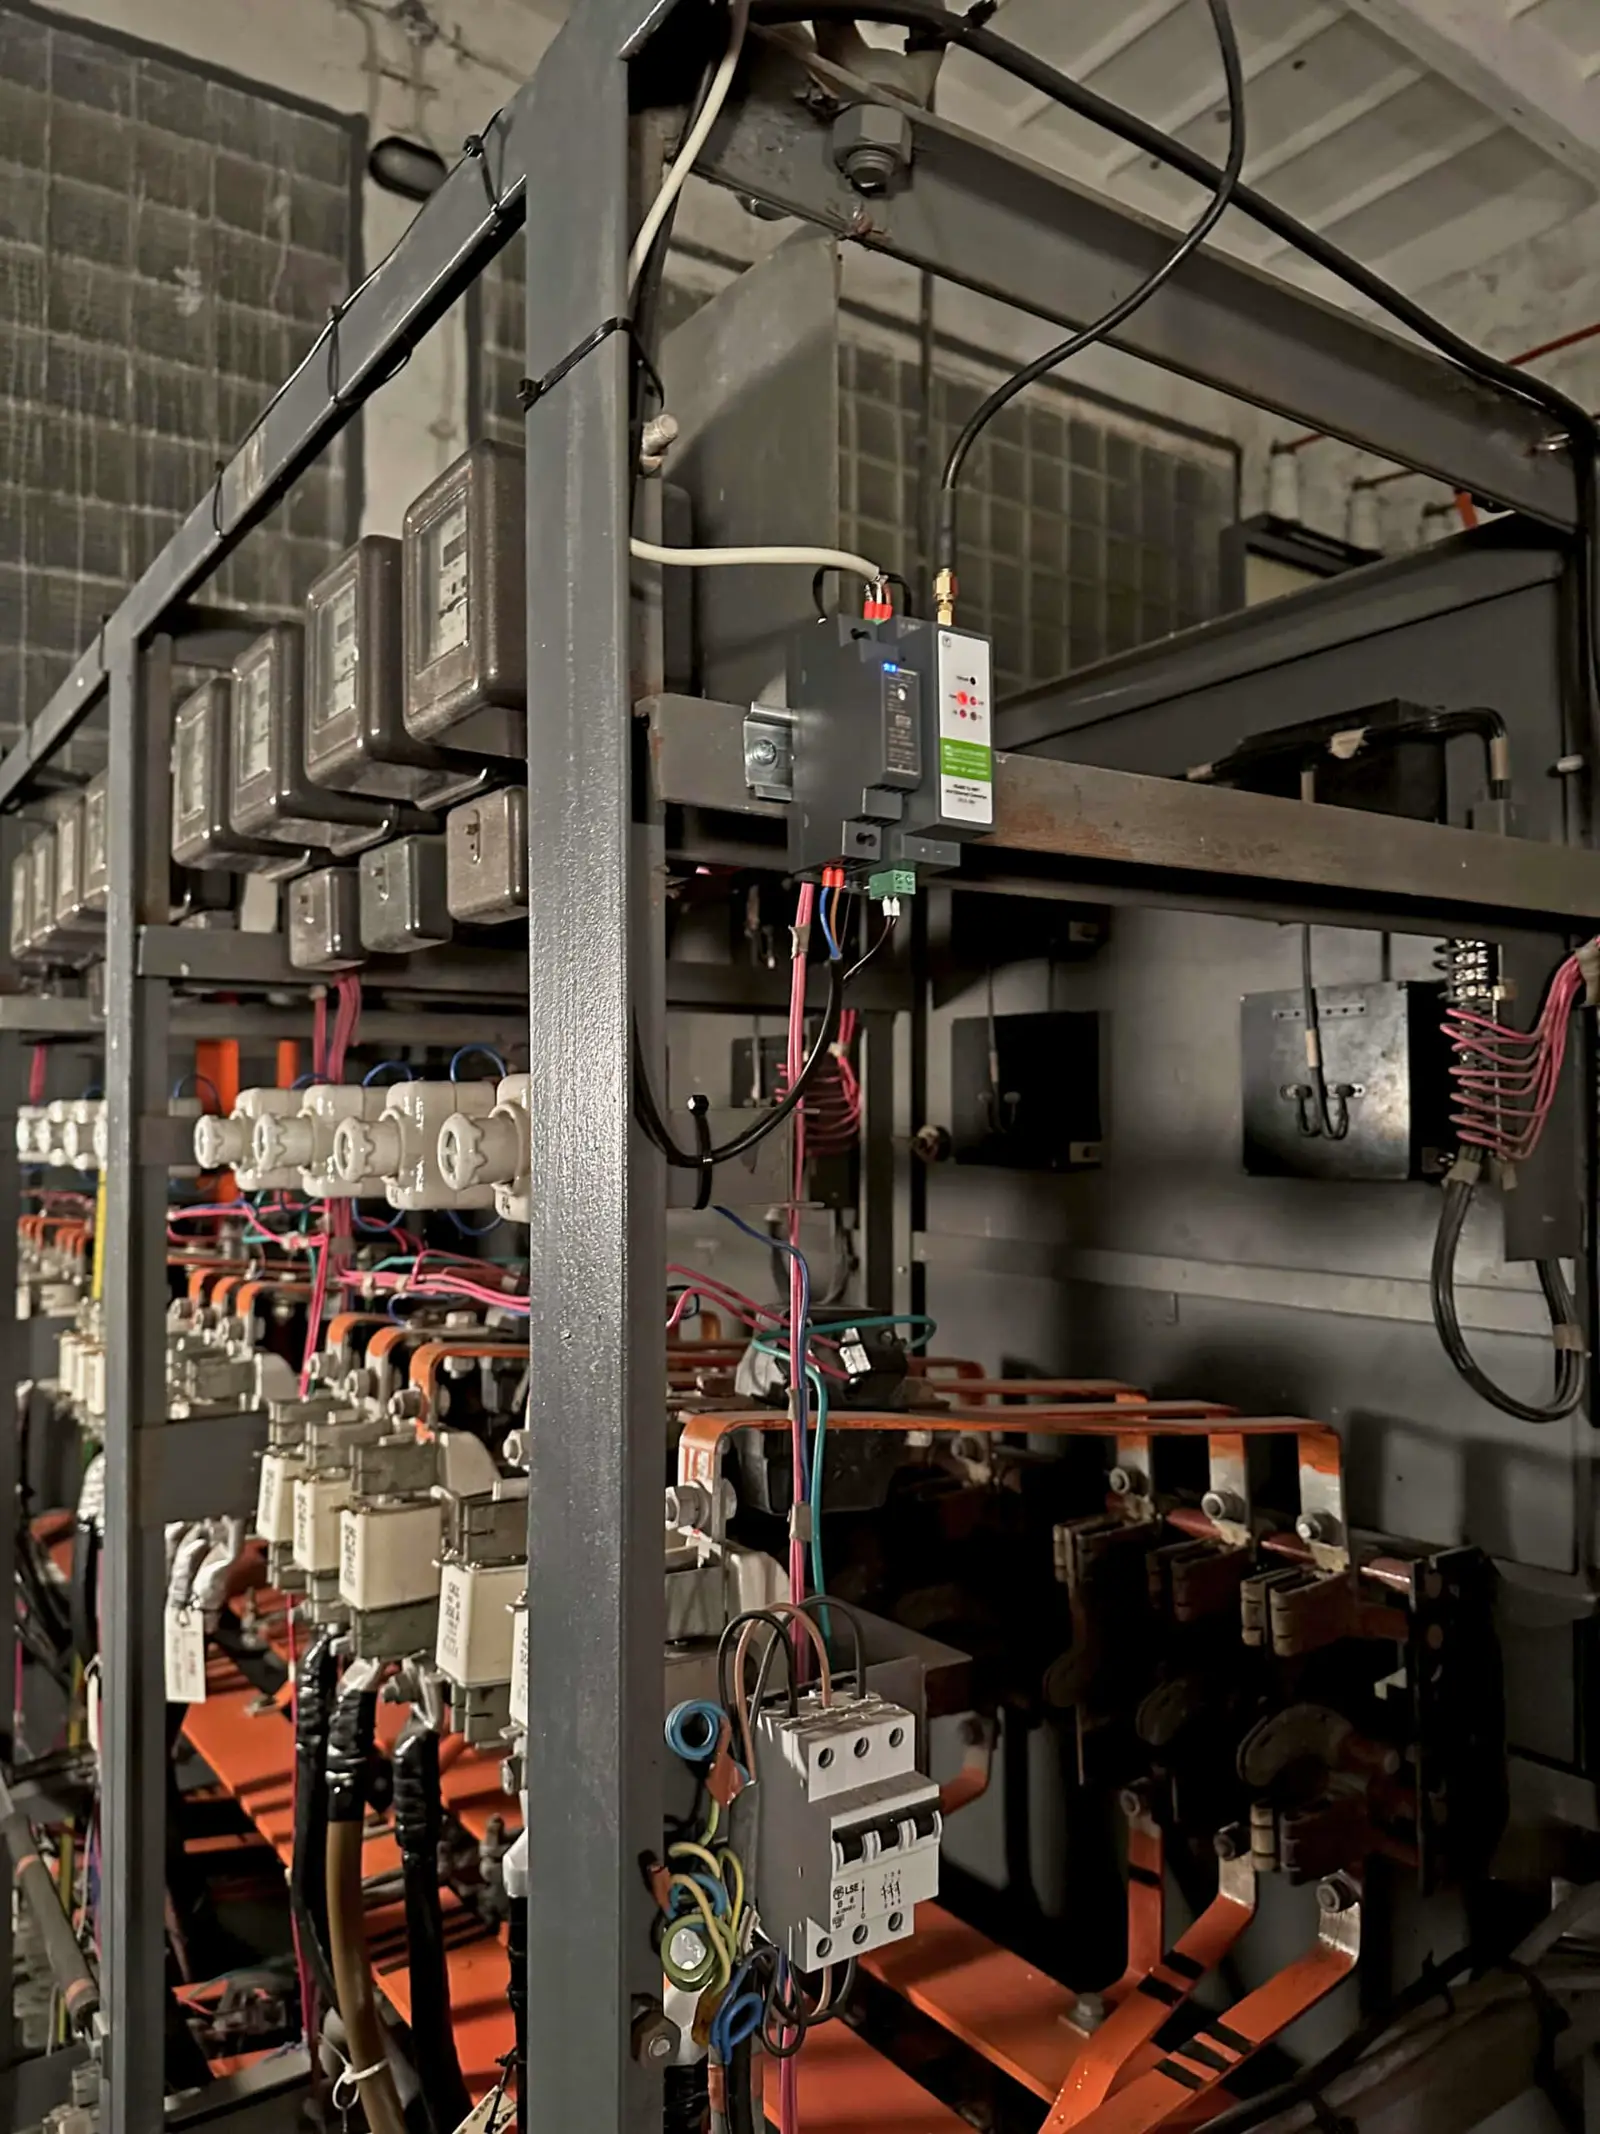
We based the technical solution on installing metering units in the secondary (low-voltage) part of the transformer stations. This approach allows electricity to be metered at a detailed level, so consumption in individual parts of the grounds can be identified and analysed precisely.
Implementation
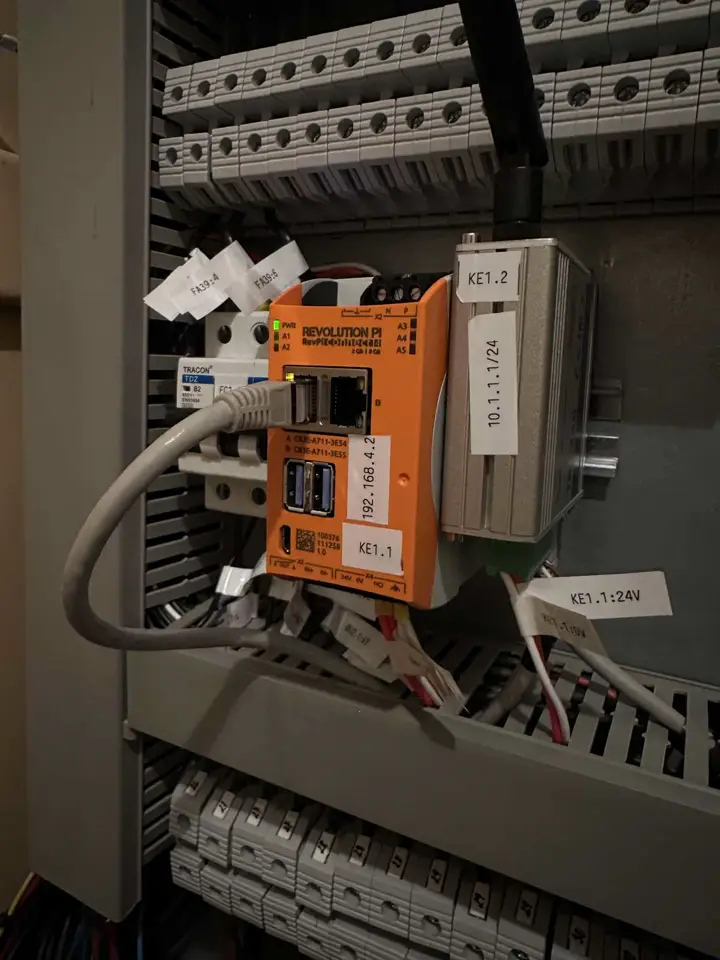
In total, we implemented 14 metering devices using the industrial Modbus RTU protocol. These units are connected to a separate VLAN, with wireless communication at the physical level through Wi-Fi access points. The VLAN is also connected through a VPN tunnel, which ensures secure, stable data transfer between the metering devices and the central system.
During the project, we had to take into account the technical condition of the older transformer stations as well as the continuous operation of the grounds. For this reason, some of the installation work was done at night to minimise shutdown times and the impact on daytime operation. The project also included calibrating and configuring the metering devices to achieve the highest possible accuracy of the measured values.
Results
A complete software system was created to process and visualise the data, giving users an online overview of the state of the electrical network. Besides monitoring, it offers analytical functions for forecasting consumption and for monitoring the MRK (maximum reserved capacity) in 15-minute intervals. This lets the operator respond in real time to changes in network load and make sure the average power drawn does not exceed the agreed limits, which helps reduce costs and manage energy resources efficiently.
On site
Photos from the project
5 shots straight from the installation.
Public sector
More projects in the segment
Continue to another segment
Contact
Want a similar result at your site?
We start with a site visit and a no-obligation quote. A pilot project on one building proves the benefit before you decide on full deployment.
Write to us
For clients and partners
- Mgr. Denis HriňCo-founderhrin@
nidextechnology.com+421 905 134 635 - Ing. Nicolas HečkoCo-founderhecko@
nidextechnology.com+421 904 418 299
Please call before visiting